

DATA-DRIVEN SOLUTIONS FOR SMARTER DECISIONS
Helping businesses transform data into actionable insights for growth.
✔ Custom dashboards & reporting tools to streamline decision-making
✔ Save time with automated business intelligence solutions
✔ Gain real-time insights to drive business efficiency

Struggling to Make Sense of Your Data?
Many businesses face challenges when it comes to:
Wasting hours on manual data processing
Making decisions based on outdated or incomplete reports
Lacking clear, visual insights into performance metrics
Missing out on growth opportunities due to poor analytics
Custom Data-Solutions That Work for You
We specialize in:
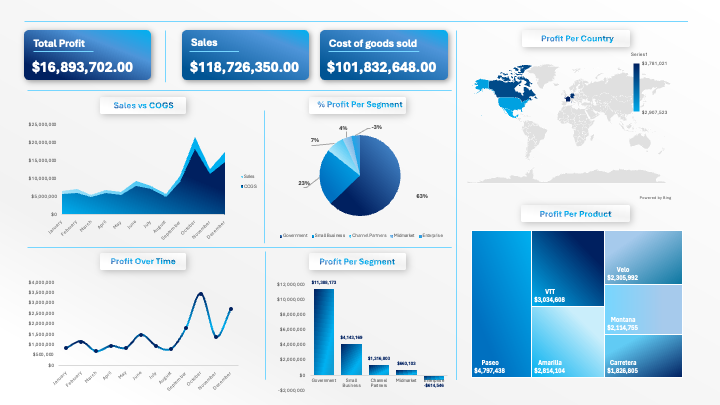
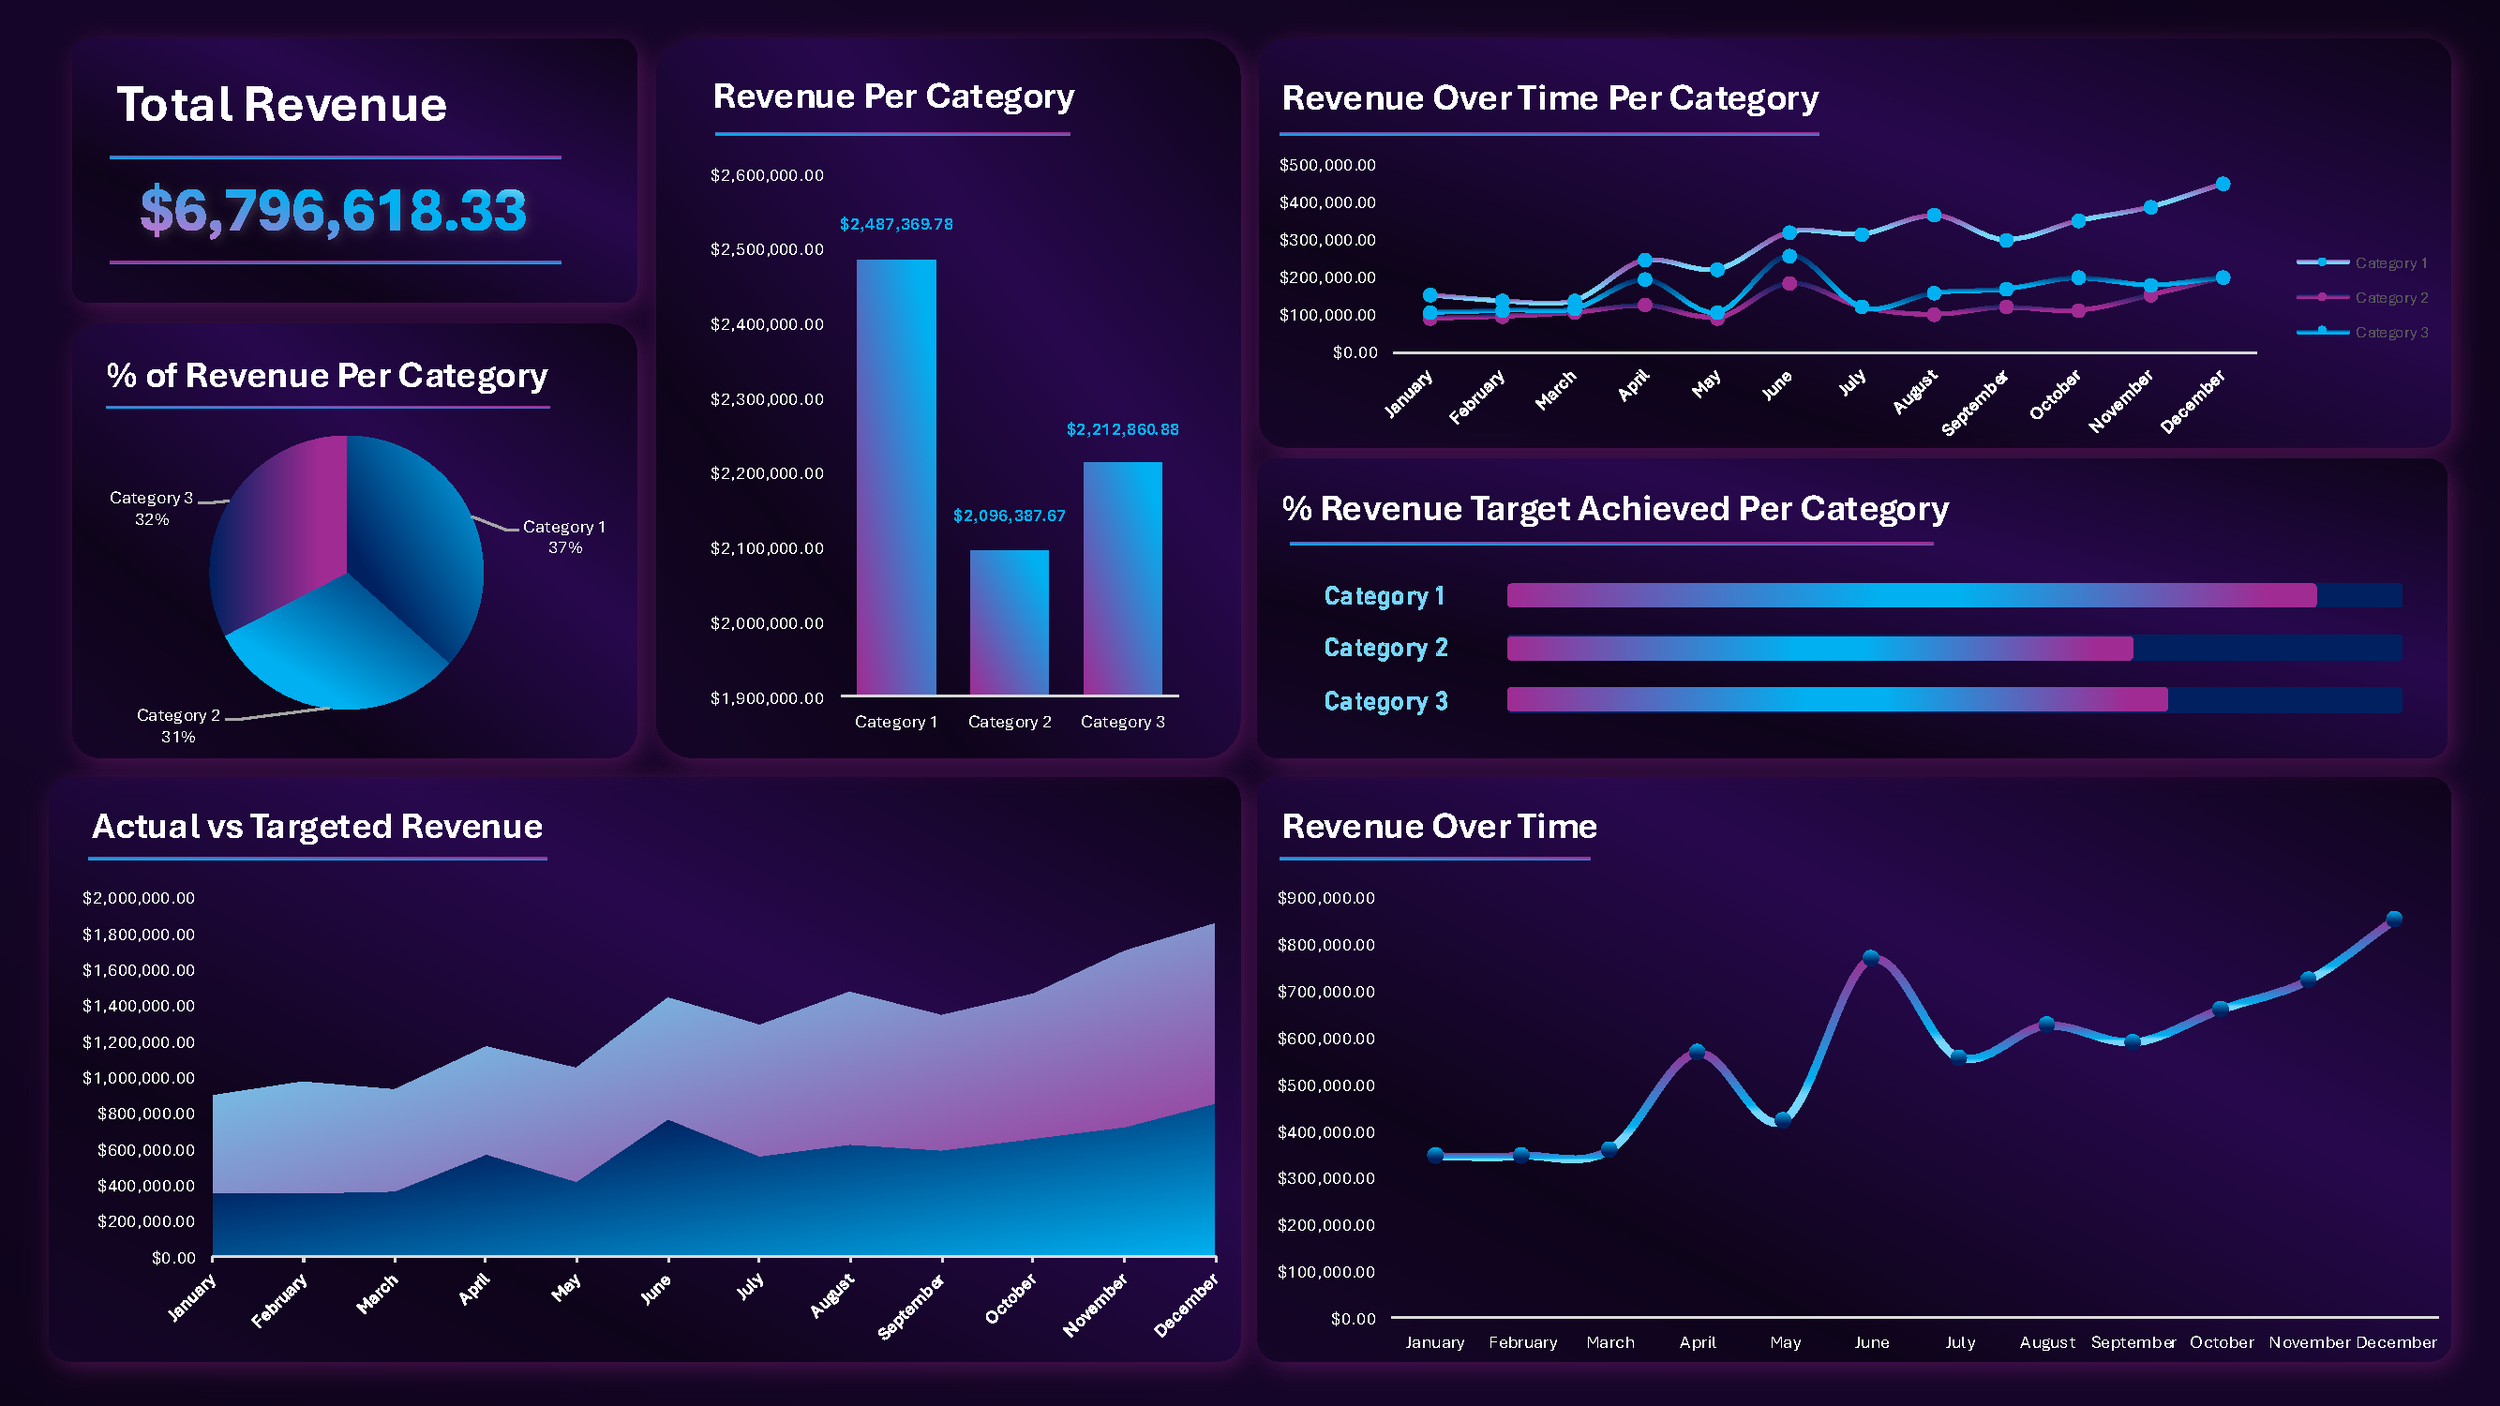
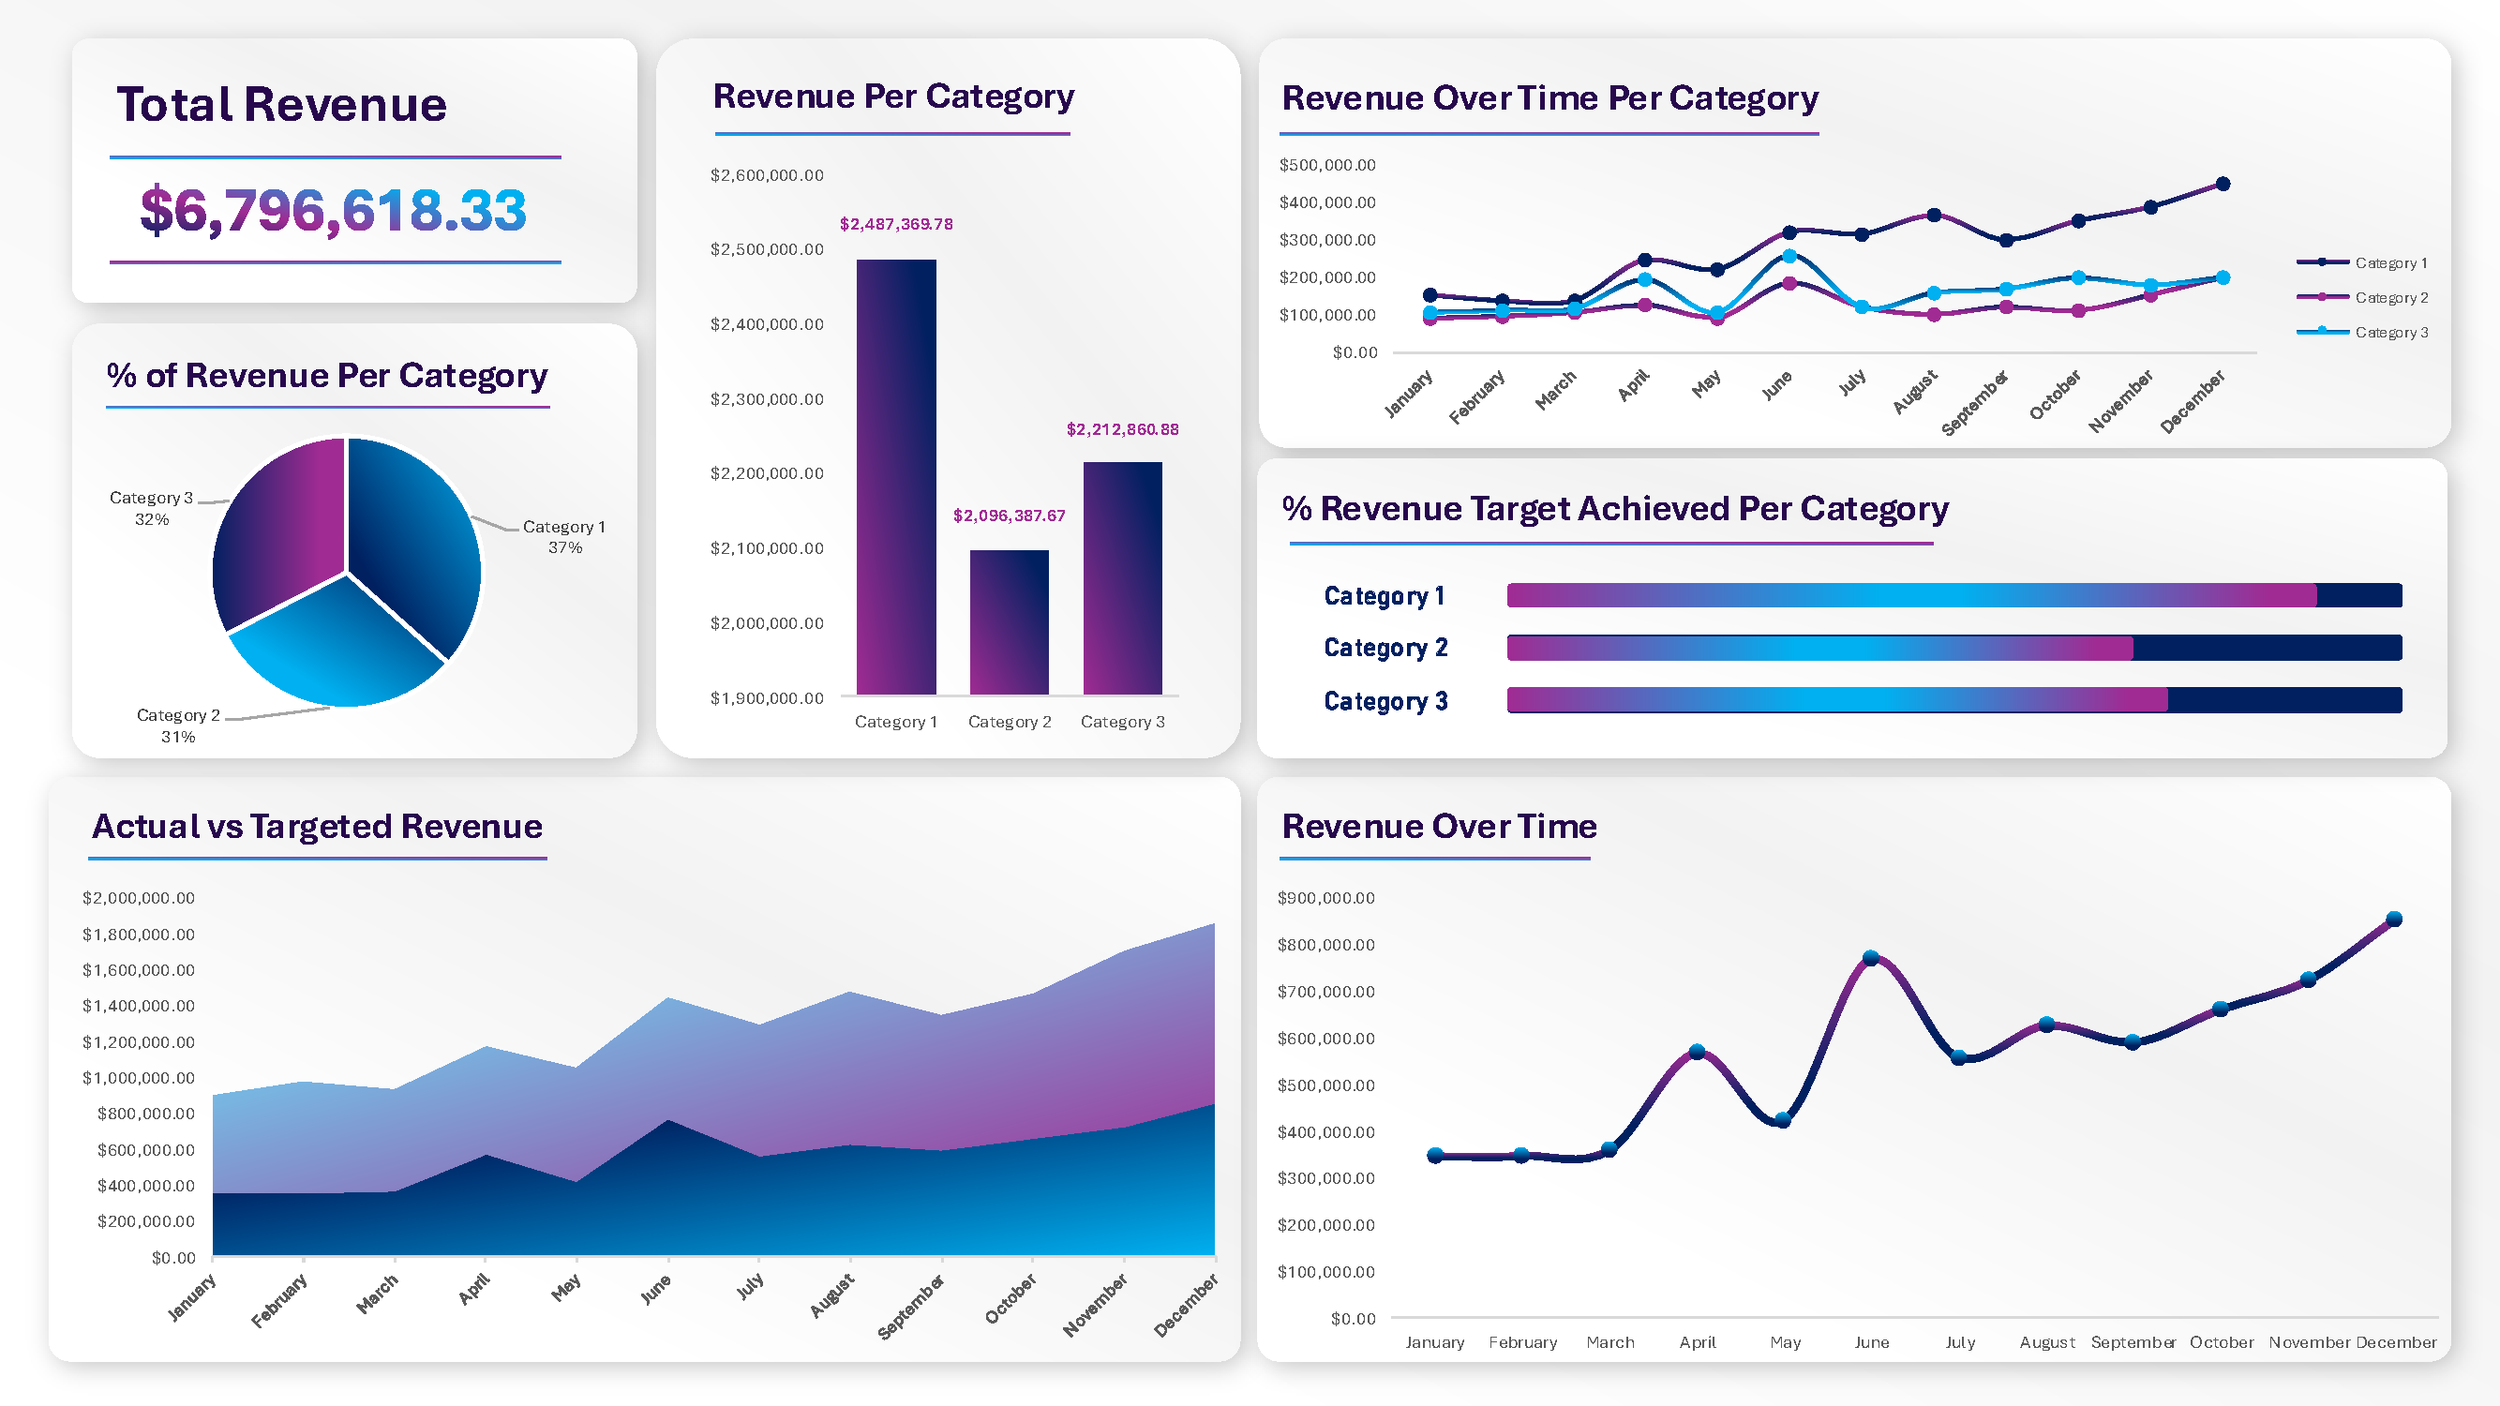
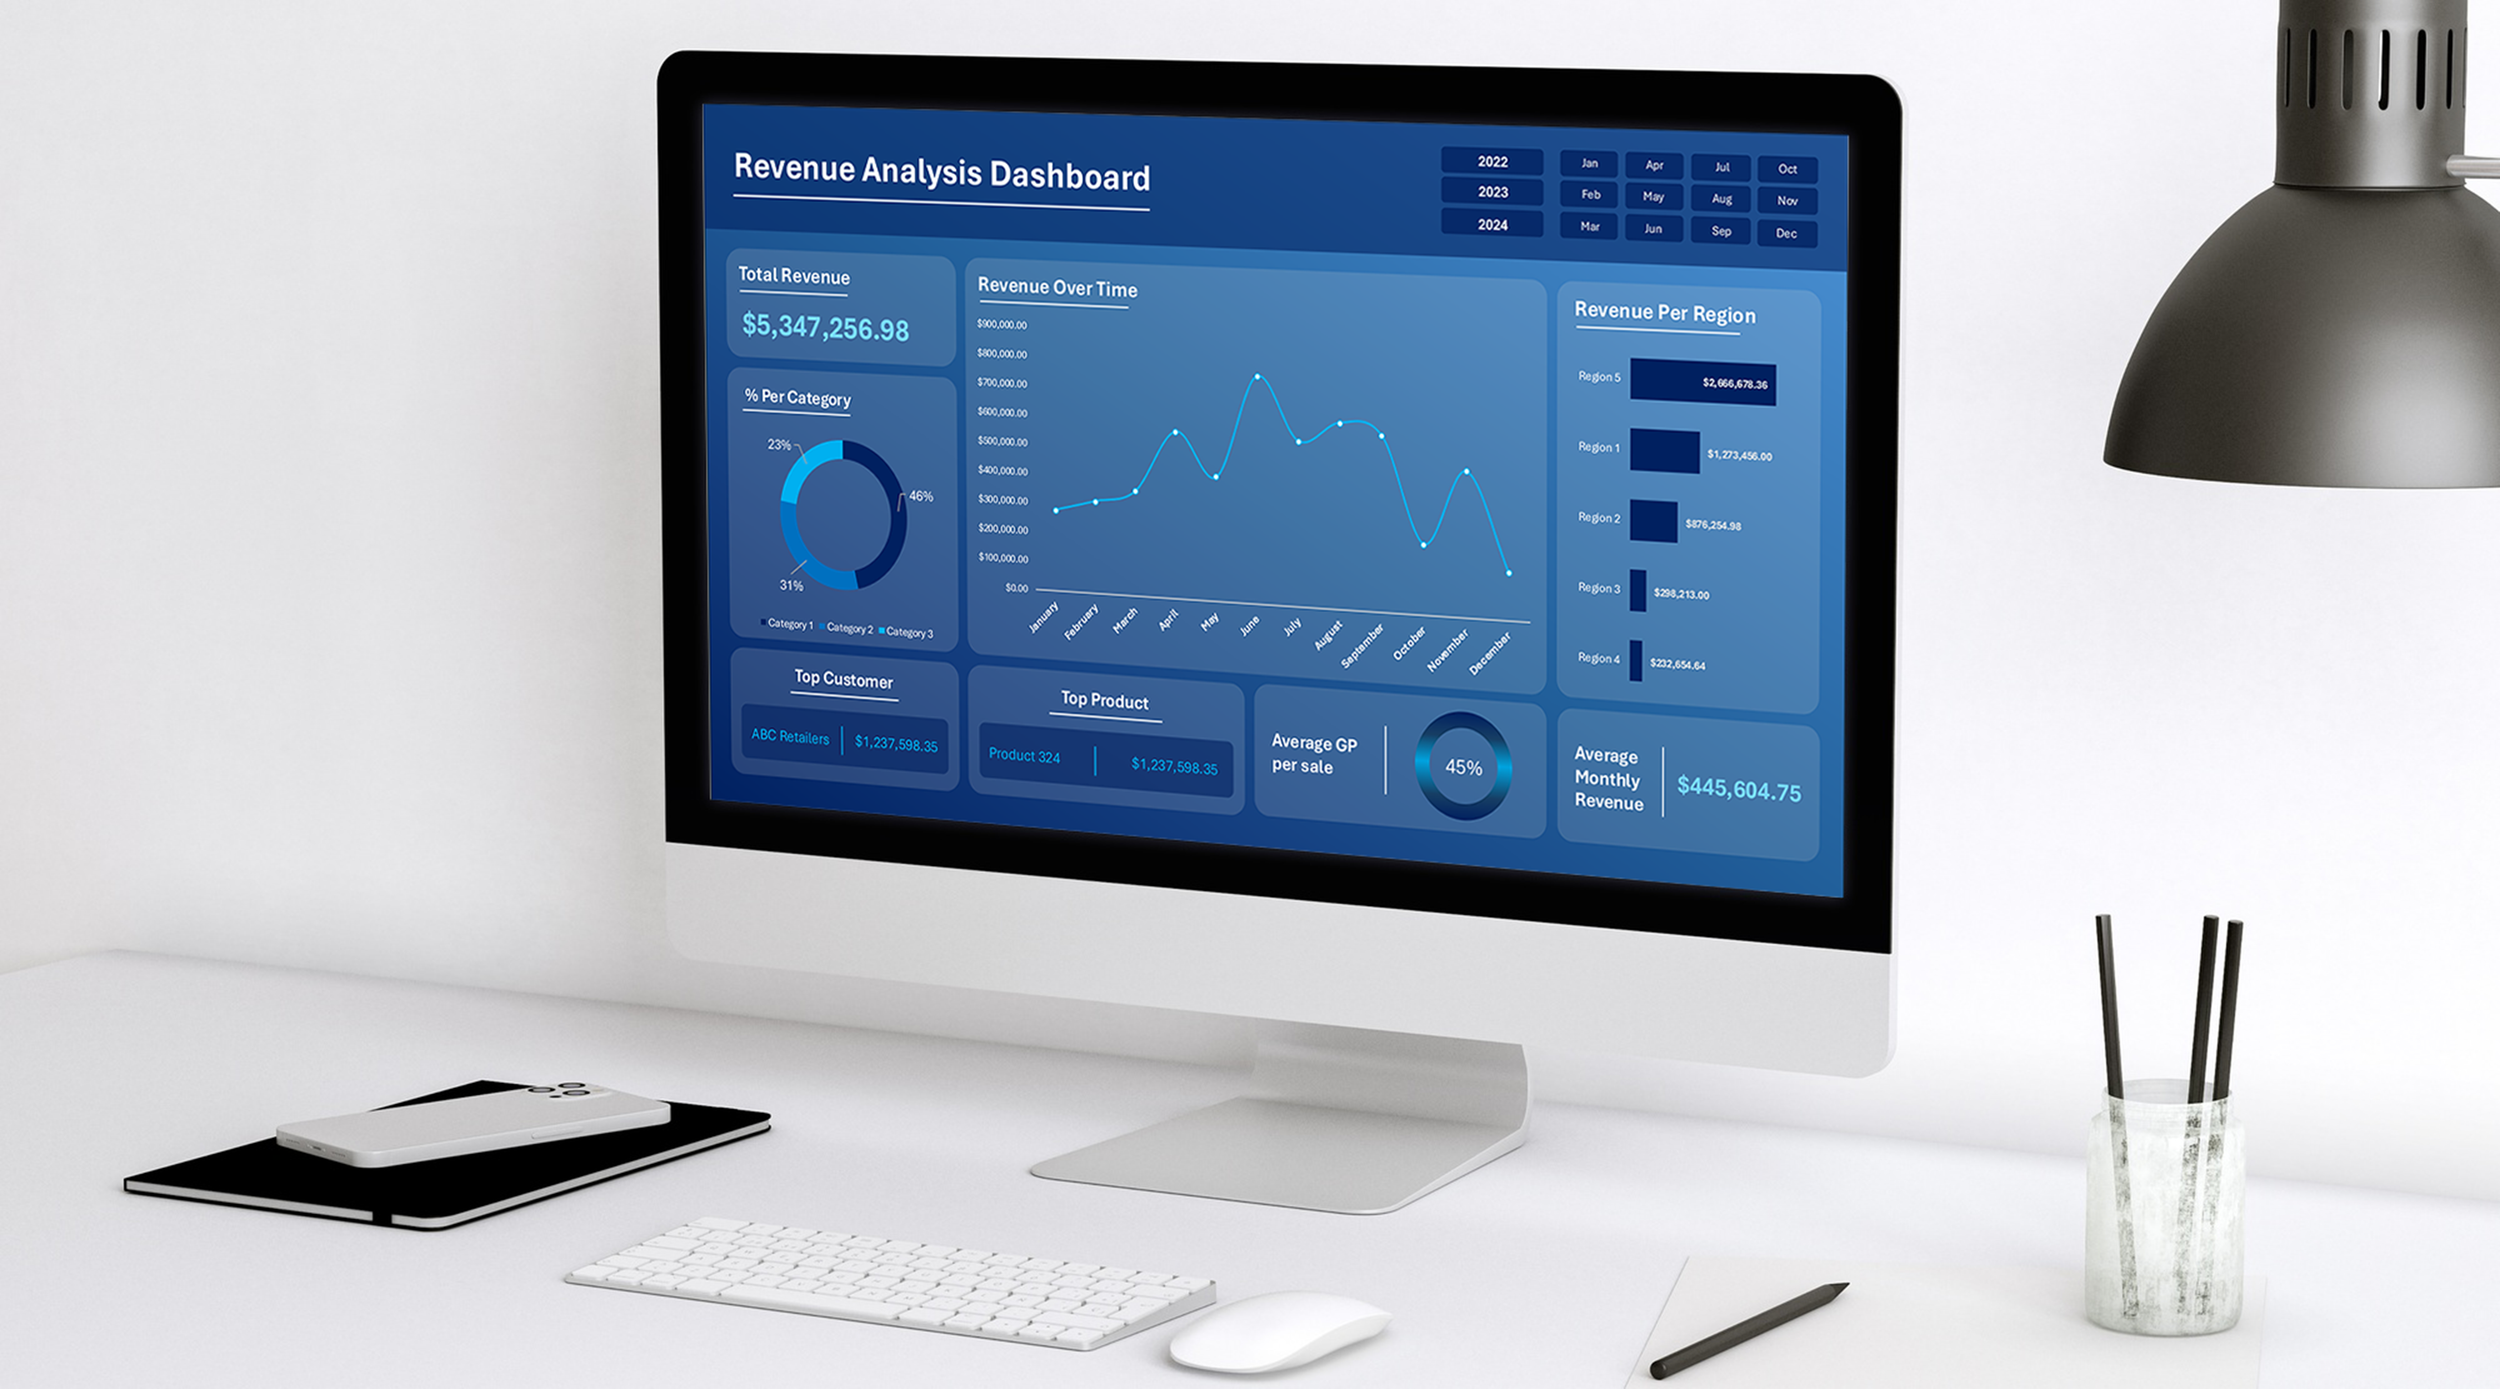
Custom Dashboards: Visualizing real-time business metrics through clean, interactive dashboards
Automated Reporting Systems: Replacing manual processes with automated, accurate, always-on reporting
Data Analysis & Insights: Turning complex data into clear trends and actionable business intelligence
Automation & AI Assistants: Streamlining workflows using smart automation tools and digital agents
With experience across multiple industries, we deliver tailored solutions that align with your business needs.


How JDRS Helps Your Business Thrive?

Clarity & Better Decision Making
Visual, real-time dashboards that show the bigger picture.

Time Saving & Efficiency
Automate reporting and free up hours every week.
Improved Performance Tracking
Set KPIs and track progress with ease.

Scalable Data Solutions
Solutions that grow with your business needs.

-
We don’t believe in one-size-fits-all solutions. At JDRS, every tool and solution we develop is fully customized to meet your specific business needs.
Whether it’s a custom dashboard or an automated reporting tool, we ensure it aligns seamlessly with your workflows. Our personalized data solutions help you make data-driven decisions that are tailored to your unique challenges, ensuring long-term success.
-
We approach every client’s business as if it were my own. We take the time to deeply understand your goals, challenges, and operational needs, ensuring that the data analysisand business intelligence tools we create provide maximum impact.
Our commitment is to deliver solutions that are not only effective but also support actionable insights that drive measurable success.
-
With a background in finance and experience across industries, we understand the operational and financial challenges that businesses face.
From optimizing sales tracking to building business intelligence dashboards, we create solutions that meet immediate needs and provide sustainable, data-driven strategies. Our expertise in developing custom reporting tools helps businesses gain valuable insights and make informed decisions.
Why Choose JDRS?

Services
JDRS offers a range of services including customized dashboards, performance tracking, and data-driven financial models designed to optimize decision-making and drive business efficiency. Our solutions are tailored to meet the unique needs of each client, ensuring measurable results.

DATA ANALYSIS & INSIGHTS
Make confident, data-backed decisions.
We turn complex datasets into visual reports that highlight trends, performance gaps, and growth opportunities—so you know what’s working, what’s not, and where to focus next.
CUSTOM DASHBOARDS
See the full picture—instantly.
We build interactive dashboards that track your key metrics in real time. From sales to KPIs to M&E performance, our dashboards turn raw data into clear, visual insight so you can act faster and smarter.

AUTOMATED REPORTING SYSTEMS
Stop wasting time on manual reports.
We create tools that automatically update and distribute your reports. Whether you’re tracking sales, finances, or operations, our automated systems keep your data fresh, accurate, and always ready.

AUTOMATION & Ai AGENTS
Let your systems do the heavy lifting.
We streamline your business with low-code automation and custom AI assistants. From auto-generated invoices to intelligent task management, we build solutions that save time and improve efficiency.

A Simple 3 Step Process to Smarter Data
-
Let’s discuss your data challenges and goals.
-
Dashboards, reports, and tools tailored to your needs.
-
Make data-driven decisions effortlessly.
-
![nfofofm]]()
“Partnering with JDRS proved to be the ideal solution—they delivered tailored, effective tools that significantly enhanced our reporting capabilities and operational agility.”
Jacky Rossouw | Sales Director | Lecico South Africa
-
![A middle-aged woman with blonde hair sitting on a red sofa in an office environment, with people working at desks in the background.]()
“The dashboard also saves time at month end when reports are due—so convenient, especially when giving feedback to customers.”
Anne Vaudin | Commercial Manager | Lecico South Africa
![nfofofm]](https://images.squarespace-cdn.com/content/v1/6713cb13b0b7ff237e34d66b/47753019-1705-49b8-96ce-3bfd6d728149/1724254965202.jpeg)

Contact Us
Interested in working together?
Fill out some info and we will be in touch shortly. We can’t wait to hear from you!